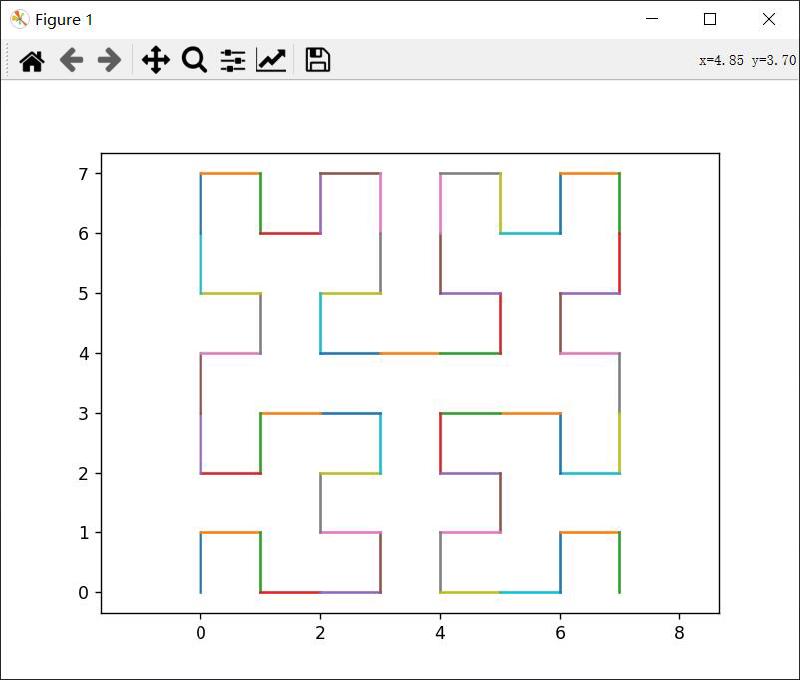
希尔伯特曲线
python实现
# Hilbert
import matplotlib.pyplot as plt
import time

start_time = time.time()

position = [0, 0]
#[x,y]
up = [0,1]
down = [0,-1]
left = [-1,0]
right = [1,0]

plt_data_x = []
plt_data_y = []

def move(list_1,list_2):
    return_list = [0,0]
    for index in range(len(list_1)):
        return_list[index] = list_1[index]+list_2[index]

    return return_list

def draw(position1,position2):
    xs = [position1[0],position2[0]]
    ys = [position1[1],position2[1]]
    # plt.plot(xs,ys)
    plt_data_x.append(xs)
    plt_data_y.append(ys)

def Hilbert(n,up,right,down,left):
    global position
    if n ==1:
        temp = move(position,up)
        draw(position,temp)
        # print(temp)
        position = temp

        temp = move(position, right)
        draw(position,temp)
        # print(temp)
        position = temp

        temp = move(position, down)
        draw(position,temp)
        # print(temp)
        position = temp

    else:
        Hilbert(n-1,right,up,left,down)

        temp = move(position,up)
        draw(position,temp)
        # print(temp)
        position = temp

        Hilbert(n-1,up,right,down,left)

        temp = move(position, right)
        draw(position,temp)
        # print(temp)
        position = temp

        Hilbert(n - 1, up, right, down, left)

        temp = move(position, down)
        draw(position,temp)
        # print(temp)
        position = temp

        Hilbert(n - 1, left, down, right, up)

Hilbert(10,up,right,down,left)
print("function has been executed,now load the data to the matplotlib")
plt.plot(plt_data_x,plt_data_y)

plt.axis("equal")

end_time = time.time()
print(f"run {end_time-start_time}s")

plt.show()
上传上来玩玩,希尔伯特曲线,改动此行Hilbert(10,up,right,down,left)的10即可改变阶数