
Python Matplotlib绘图库介绍
安装库
没啥好说的,pip install 一下就行
pip install matplotlib
使用基础
import matplotlib.pyplot as plt
以下默认你已经安装好matplotlib库并都已经在新建的py文件中加入了以上调用这个库的命令
最简单的使用命令,也就是一行x一行y的数字输入进plot函数。 下面一步一步讲解:
首先先给x和y进行赋值,以以下的赋值操作为例
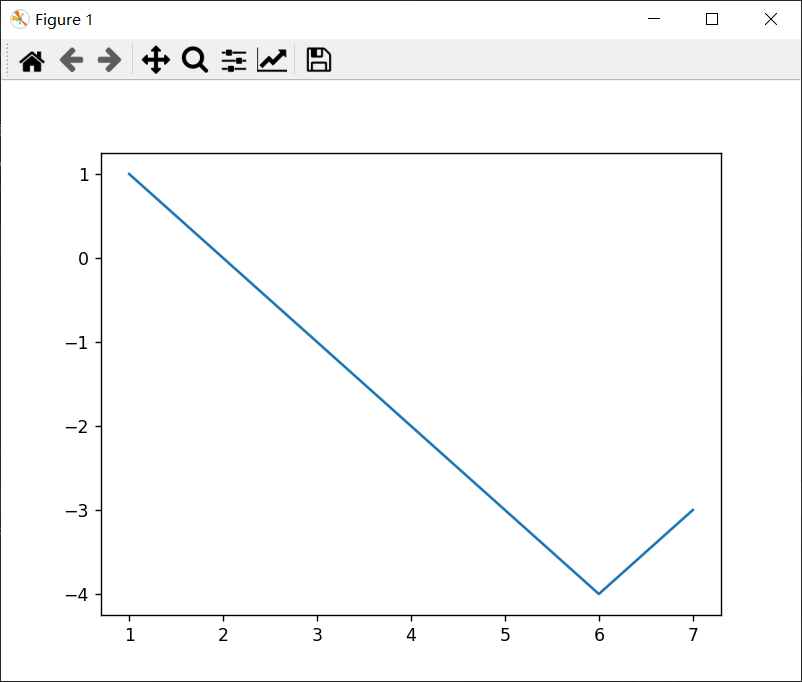
 x = [1,2,3,4,5,6,7]
 y = [1,0,-1,-2,-3,-4,-3]
 plt.plot(x,y)
 plt.show()
赋值完毕之后直接进行plot操作读入类似缓存区的位置,然后再由plt.show()输出包含着图表 (figure) 的窗口
同时绘制多条直线?
x = [[1,2,3,4,5,6,7],
     [1,2,3,4,5,6,7]]
y = [[1,0,-1,-2,-3,-4,-3],
     [1,2,3,4,5,6,8]]
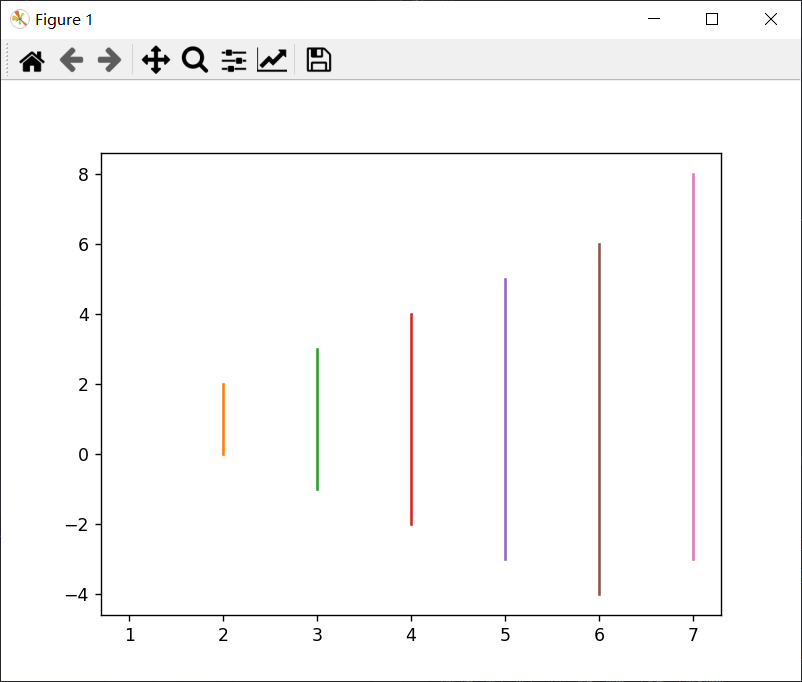
没错,我第一反应也是这个,但把数据输入进去就知道不对劲了,我们按照这个方法把图输入进去
plt.plot(x, y)
plt.show()
但输出完就傻眼了,什么情况?
| x | 1 | 2 | 3 | 4 | 5 | 6 | 7 |
|---|---|---|---|---|---|---|---|
| y | 1 | 0 | -1 | -2 | -3 | -4 | -3 |
| x | 1 | 2 | 3 | 4 | 5 | 6 | 7 |
| y | 1 | 2 | 3 | 4 | 5 | 6 | 8 |
而现在则成了,左边两列的x和y分别表示作为一个点,跟右边两列也分别表示作为一个点,然后这两个点连起来
| x | y | x | y | |
|---|---|---|---|---|
| 1 | 1 | 1 | 1 | |
| 2 | 0 | 2 | 2 | |
| 3 | -1 | 3 | 3 | |
| 4 | -2 | 4 | 4 | |
| 5 | -3 | 5 | 5 | |
| 6 | -4 | 6 | 6 | |
| 7 | -3 | 7 | 8 |
好像比较麻烦?但没关系,numpy有矩阵转置功能 就是要先把x强制转成矩阵
转矩阵后转置本身
先导入numpy包,一般取别名作np
import numpy as np
强制把x和y转为矩阵
x = np.array(x)
y = np.array(y)
然后把转置矩阵赋值给本身
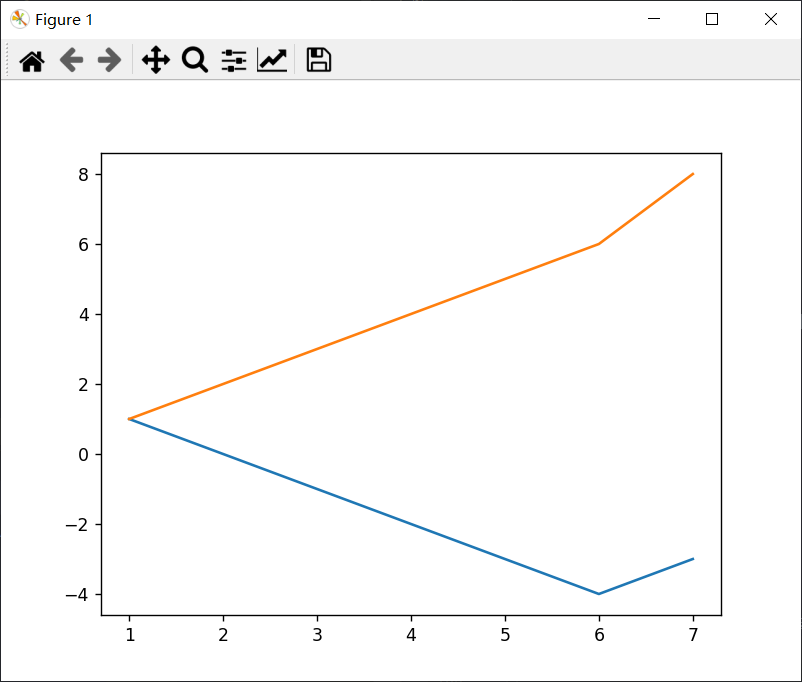
x = x.T
y = y.T
如果你到python控制台做完这些去看x和y的结果就会得到类似下面的结果,y也相同,此时对x和y进行绘图操作就可以得到想要的图了
print(x)
[[1 1]
 [2 2]
 [3 3]
 [4 4]
 [5 5]
 [6 6]
 [7 7]]
顺带一提,矩阵和包含数的列表都可以被matplotlib接收
此时plot(x,y)即可得到结果
不同区域显示?
plt库包含subplot功能,可以进行一张figure的多个区域的分割,用法则是,plt.subplot()结束表示在你表示的区域绘图
其中可以用简单的数字来表示,第一个数字表示把宽分隔成多少行,第二个数字表示把长分割成多少列,比如说plt.subplot(4,4,1)最后一个数表示
位置,其中三个数都小于9可以直接写在一起,plt.subplot(441)
subplot(441)
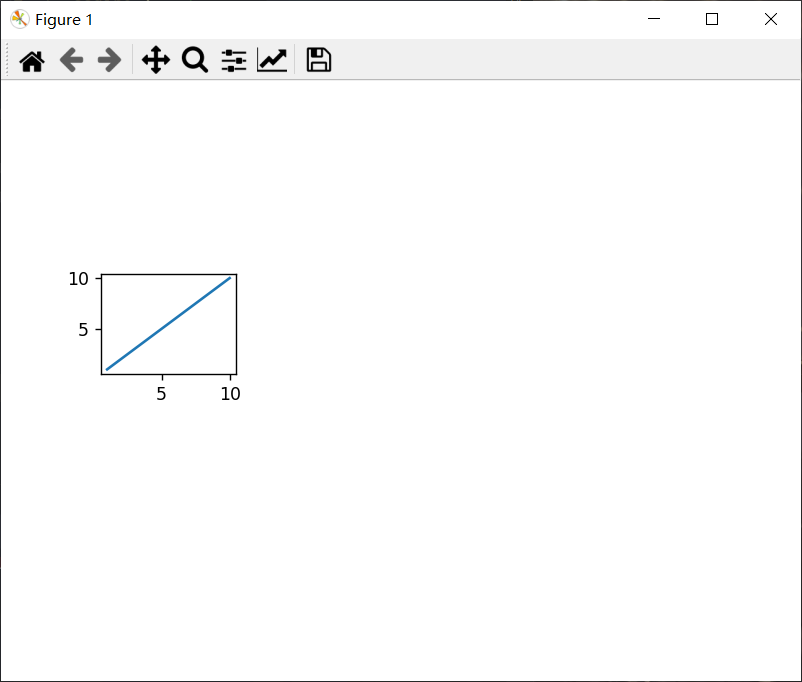
subplot(445)
示例代码
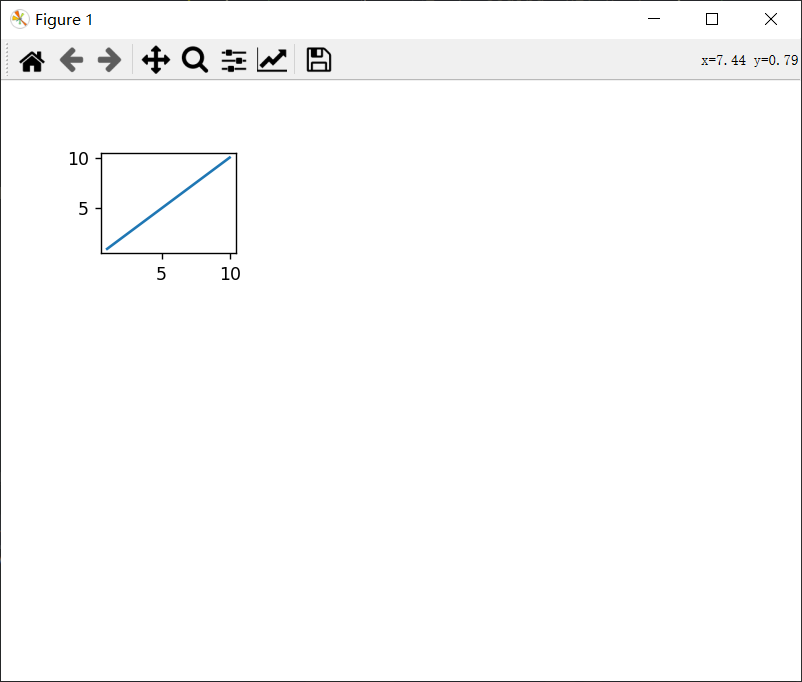
plt.subplot(4,4,5)
plt.plot(x, y)
plt.show()
也支持同时绘制
plt.subplot(4,4,5)
plt.plot(x, y)
plt.subplot(4,4,1)
plt.plot(x, y)
plt.show()
这里别急着直接plt.show(),已有subplot()选中某块区域绘制的情况下,再有subplot等于是切换区域绘制
最后都绘制完了就可以plt.show()了
更进阶的方法
plt.subplot2grid((3,3),(0,0),colspan=3,rowspan=1)
plt.plot(x, y)
plt.subplot(3,3,4)
plt.plot(x, y)
plt.show()
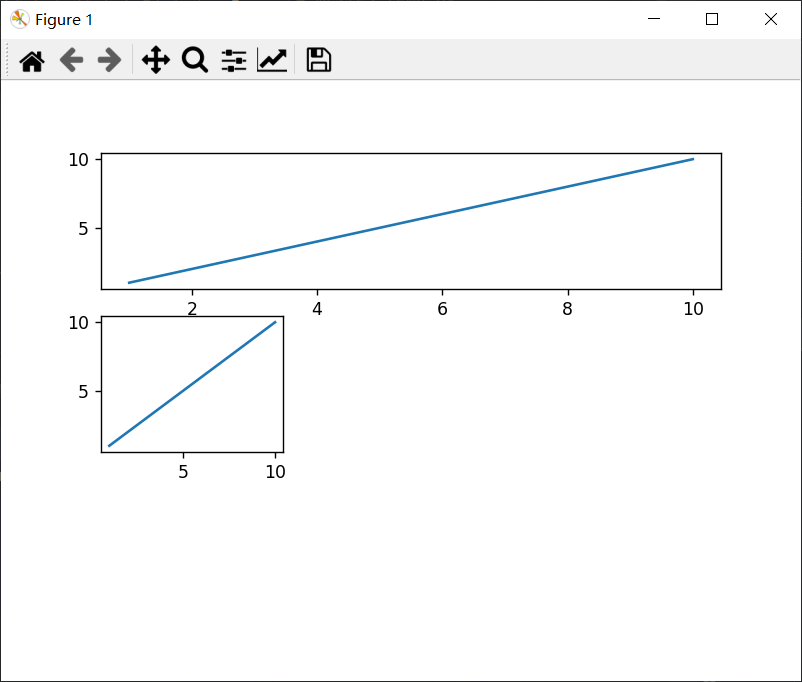
效果
利用subplot2grid函数也可以实现这一点,其中(3,3)是前面横竖分割,(0,0)表示起始位置,然后后两个参数表示从左上(0,0)往右下两个方向分别扩张的距离
一些配置
# 图表标题
plt.title("title1")
# x轴上的标签
plt.xlabel("dB")
# y轴上的标签
plt.ylabel("Hz")
# 打开网格(默认false)
plt.grid("true")
其他绘制函数
散点图
plt.scatter(x,y)
plt.show()
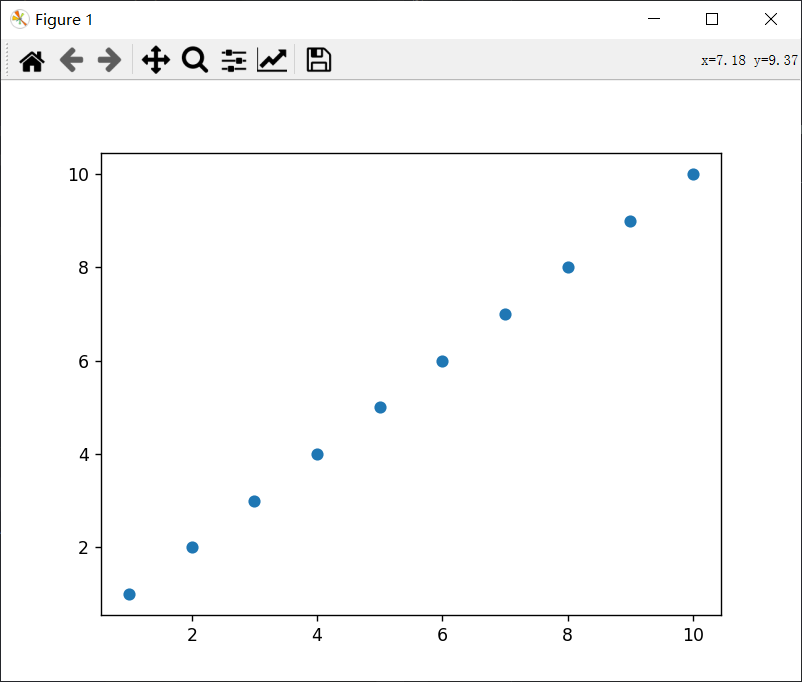
效果
柱状图
plt.bar(x,y)
plt.show()
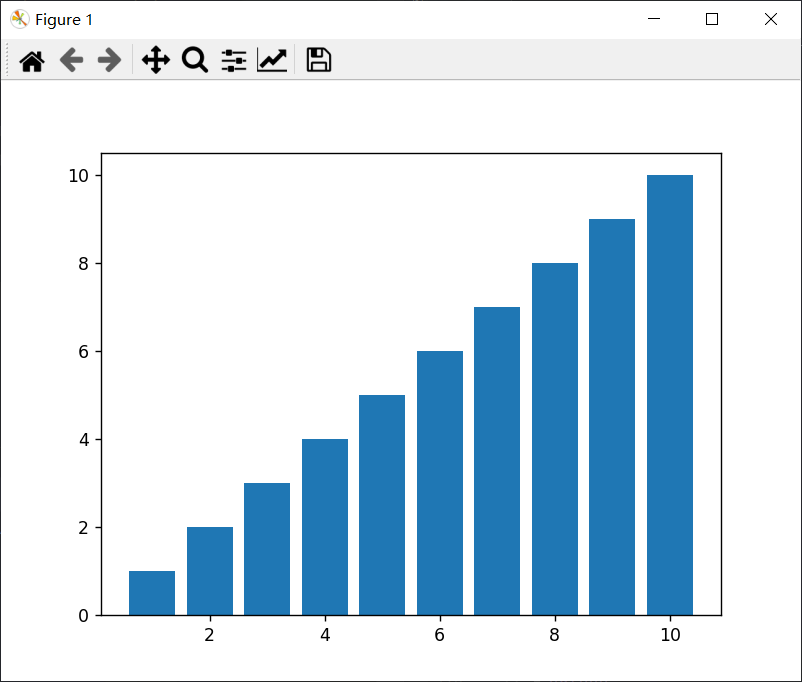
效果
读取图片展示在图表上,当时翻函数翻到了,没想到除了cv2,plt也有读入图片文件的函数
# 需要当前目录有picture.png

# 载入图片到img1变量
img1 = plt.imread("picture.png")
# 把变量载入暂存区
plt.imshow(img1)
# 展示图片
plt.show()
其他技巧
#显示中文
plt.rcParams["font.sans-serif"] = ['SimHei']
#显示负号
plt.rcParams["axes.unicode_minus"] = False